We use dietary intake surveys of what people eat a lot. They are needed to support the design, monitoring, and evaluation of food-based nutrition programmes that aim to improve dietary adequacy in populations. In a world where over one-third of people have unhealthy diets, getting this right matters.
Although dietary surveys share the aim to quantify the amount and types of foods consumed in a population and the nutrients they provide, they can take many forms. While some types of dietary surveys provide more detailed and accurate information than others, they also tend to be more technically challenging and expensive to implement. For example, surveys that determine all foods consumed by respondents in the past 24 hours, including recipes and amounts consumed, provide more information but are more difficult to implement than a questionnaire that asks only about the frequency with which certain foods are consumed while assuming the same average portion sizes for all.
All surveys face a common challenge - getting reliable estimations of the amounts of foods and beverages actually consumed by a respondent. Some survey types (e.g. 24-hour dietary recall) use a variety of methods to estimate portion sizes consumed, such as standard household measures (e.g. cups, tablespoons), or food models (e.g. 3-dimensional models, clay). The use of these portion size estimation methods requires significant technical skills of the interviewer, and an ability of the respondent to conceptualise the actual portion size using the measures or models.
Such technical challenges can put off countries from either conducting dietary surveys, or from obtaining reliable information if challenges are underestimated.
To simplify this process, food photo series depicting a range of five or more portion sizes in increasing amounts for each food are being adopted as a simple, rapid method for respondents to estimate food amounts consumed. Some studies have indicated the use of photographic images for this purpose are at least as accurate as other methods.
While this simplicity is very attractive for researchers, the development of a food photo series does require some critical inputs to design them effectively. First, the selection of foods to appear in the photos should include all the nutritionally-relevant foods likely to be consumed in the population; missing foods will mean that amounts consumed will unlikely be captured and true food and nutrient intakes will be underestimated. Second, the portion sizes depicted in the photo should represent the range of amounts actually consumed by the target population; photo options that don't cover the portion sizes typically consumed will be prone to error.
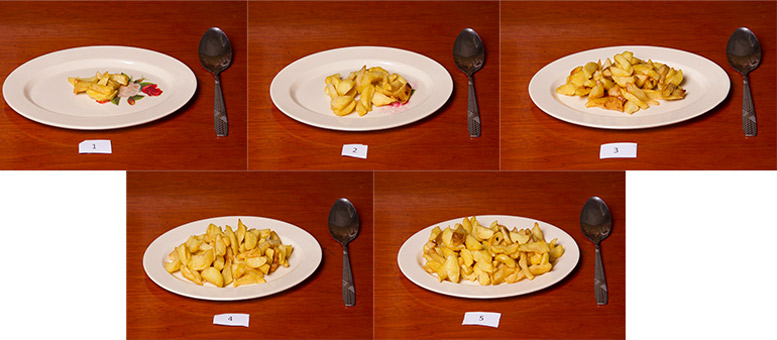
Food photo series depicting a range of five or more portion sizes in increasing amounts for each food are being adopted as a simple, rapid method for respondents to estimate food amounts consumed. © Christine Hotz
Ideally, the information needed to design reliable food photo series is derived from previous survey data from the same population. However, in many situations, particularly in lower-income countries, previous data are not available and in our review of the literature and other published guidelines, we found no clear guidance on how to design these tools in the absence of pre-existing dietary data. Previous studies using food photo series have used informal approaches such as consulting recipe books and food service professionals, or using average portion sizes to represent a "medium" portion size and deriving smaller or larger portion sizes by applying an arbitrary factor. It was not clear how well the foods selected or the portion size ranges selected for photos reflected what is actually consumed in the survey population.
So what did we do about this?
We undertook to design and field test simple data collection methods to determine which foods to include in a dietary survey using food photos to estimate portion sizes and to determine the portion size amounts typically consumed in a target population. This was undertaken in a semi-rural population of women in Uganda.
To identify the foods to include in the portion size food photos, we held facilitated group discussions with key informants (local government nutrition and agriculture professionals) and with small groups of women sampled from a survey area. Respondents were led through each food group, providing details on the specific foods consumed, how they are prepared (e.g. raw or cooked, cooking method), and whether used as ingredients in mixed dishes. We then asked respondents to score each food mentioned for their likelihood of being consumed (1, high; 2, moderate; 3, low; 4, not likely), taking seasonal availability into account.
When compared to foods reported as consumed during a 24-hour dietary recall survey by women in the same area, where all foods consumed in the previous 24-hours are solicited by trained interviewers, 87% were among those scored with a high or medium likelihood of being consumed and accounted for 95% of estimated energy (kilocalorie) intake. That means this simple scoring process successfully identified the most significant foods in the diet.
Next, for all foods that were scored with a "high" or "medium" likelihood of being consumed, we held interactive sessions with women from the survey area to estimate their usual portion size amounts. Foods were prepared as typically consumed and made available in the sessions, providing a realistic form for respondents to visualise and estimate portion sizes. For each food, women were asked whether they ever consume it and, if so, to recall the amount consumed the last time they ate it. She then served this amount into a dish for weighing. In this way, we were able to collect a large amount of data on usual portion sizes for common foods in a short amount of time. These results were later used to establish five portion sizes to be represented in photos, ranging from the 5th to 95th percentiles of the portion size weights.
When compared to the 24-hour recall survey results, the portion sizes of many foods overlapped significantly, giving confidence that these interactive sessions produced consistent results with the standard methods typically used in dietary surveys. However, several foods that did not compare well were those served in standard unit amounts, such as a slice of bread, or a baked good item. We concluded that these items are better estimated by indicating the number (or fraction) of units consumed, rather than using photos representing a statistically derived distribution of weights.
Although it is not clear why, portion size estimates for other foods, such as beef and mangos, differed greatly between the two methods. These foods would require additional study on how to better estimate portion sizes, and whether food models or photos produce more accurate results.
While additional studies may be needed to refine and validate these methods, we have provided a promising set of simple field methods to assist researchers in designing simplified dietary surveys.